SmartPLS 4 is now available!
SmartPLS overview
SmartPLS is a milestone in latent variable modeling. It combines state of the art methods (e.g., PLS-POS, IPMA, complex bootstrapping routines) with an easy to use and intuitive graphical user interface.
Features: what's new in SmartPLS 4?
SmartPLS 4 introduces the following notable new features. As part of an early access phase, many videos on SmartPLS4 have already been created to help you with your transition.
CB-SEM
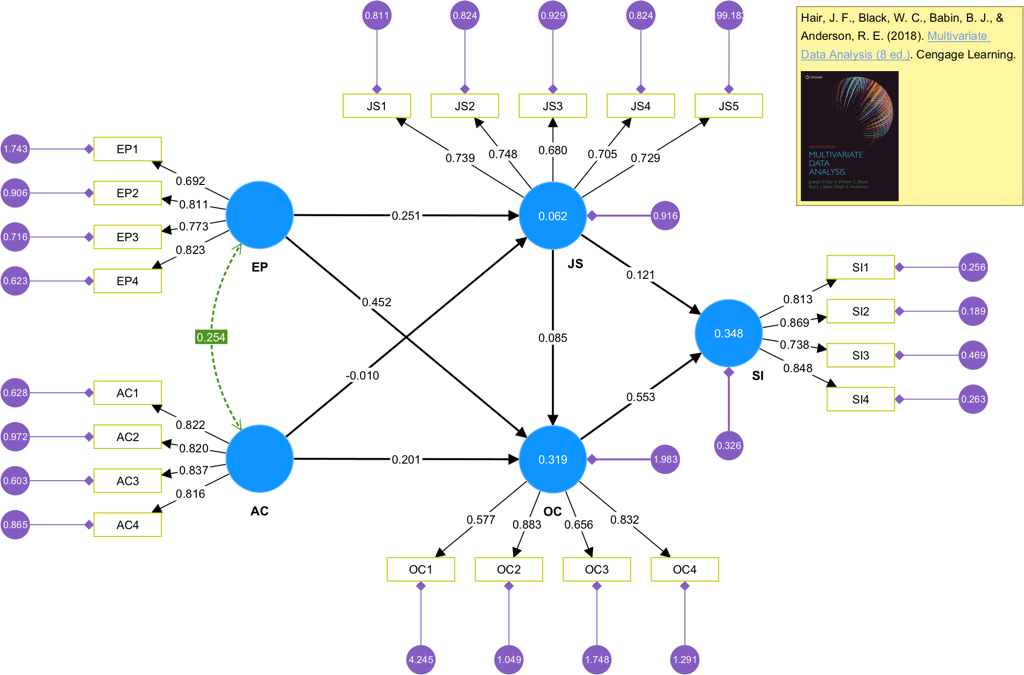
You can run covariance-based structural equation modeling (CB-SEM) analyses (like in IBM® SPSS® Amos).
Thereby, you can now create, estimate, and evaluate models using CB-SEM. You can also use this new feature to run a confirmatory factor analysis (CFA)..
Redesigned GUI
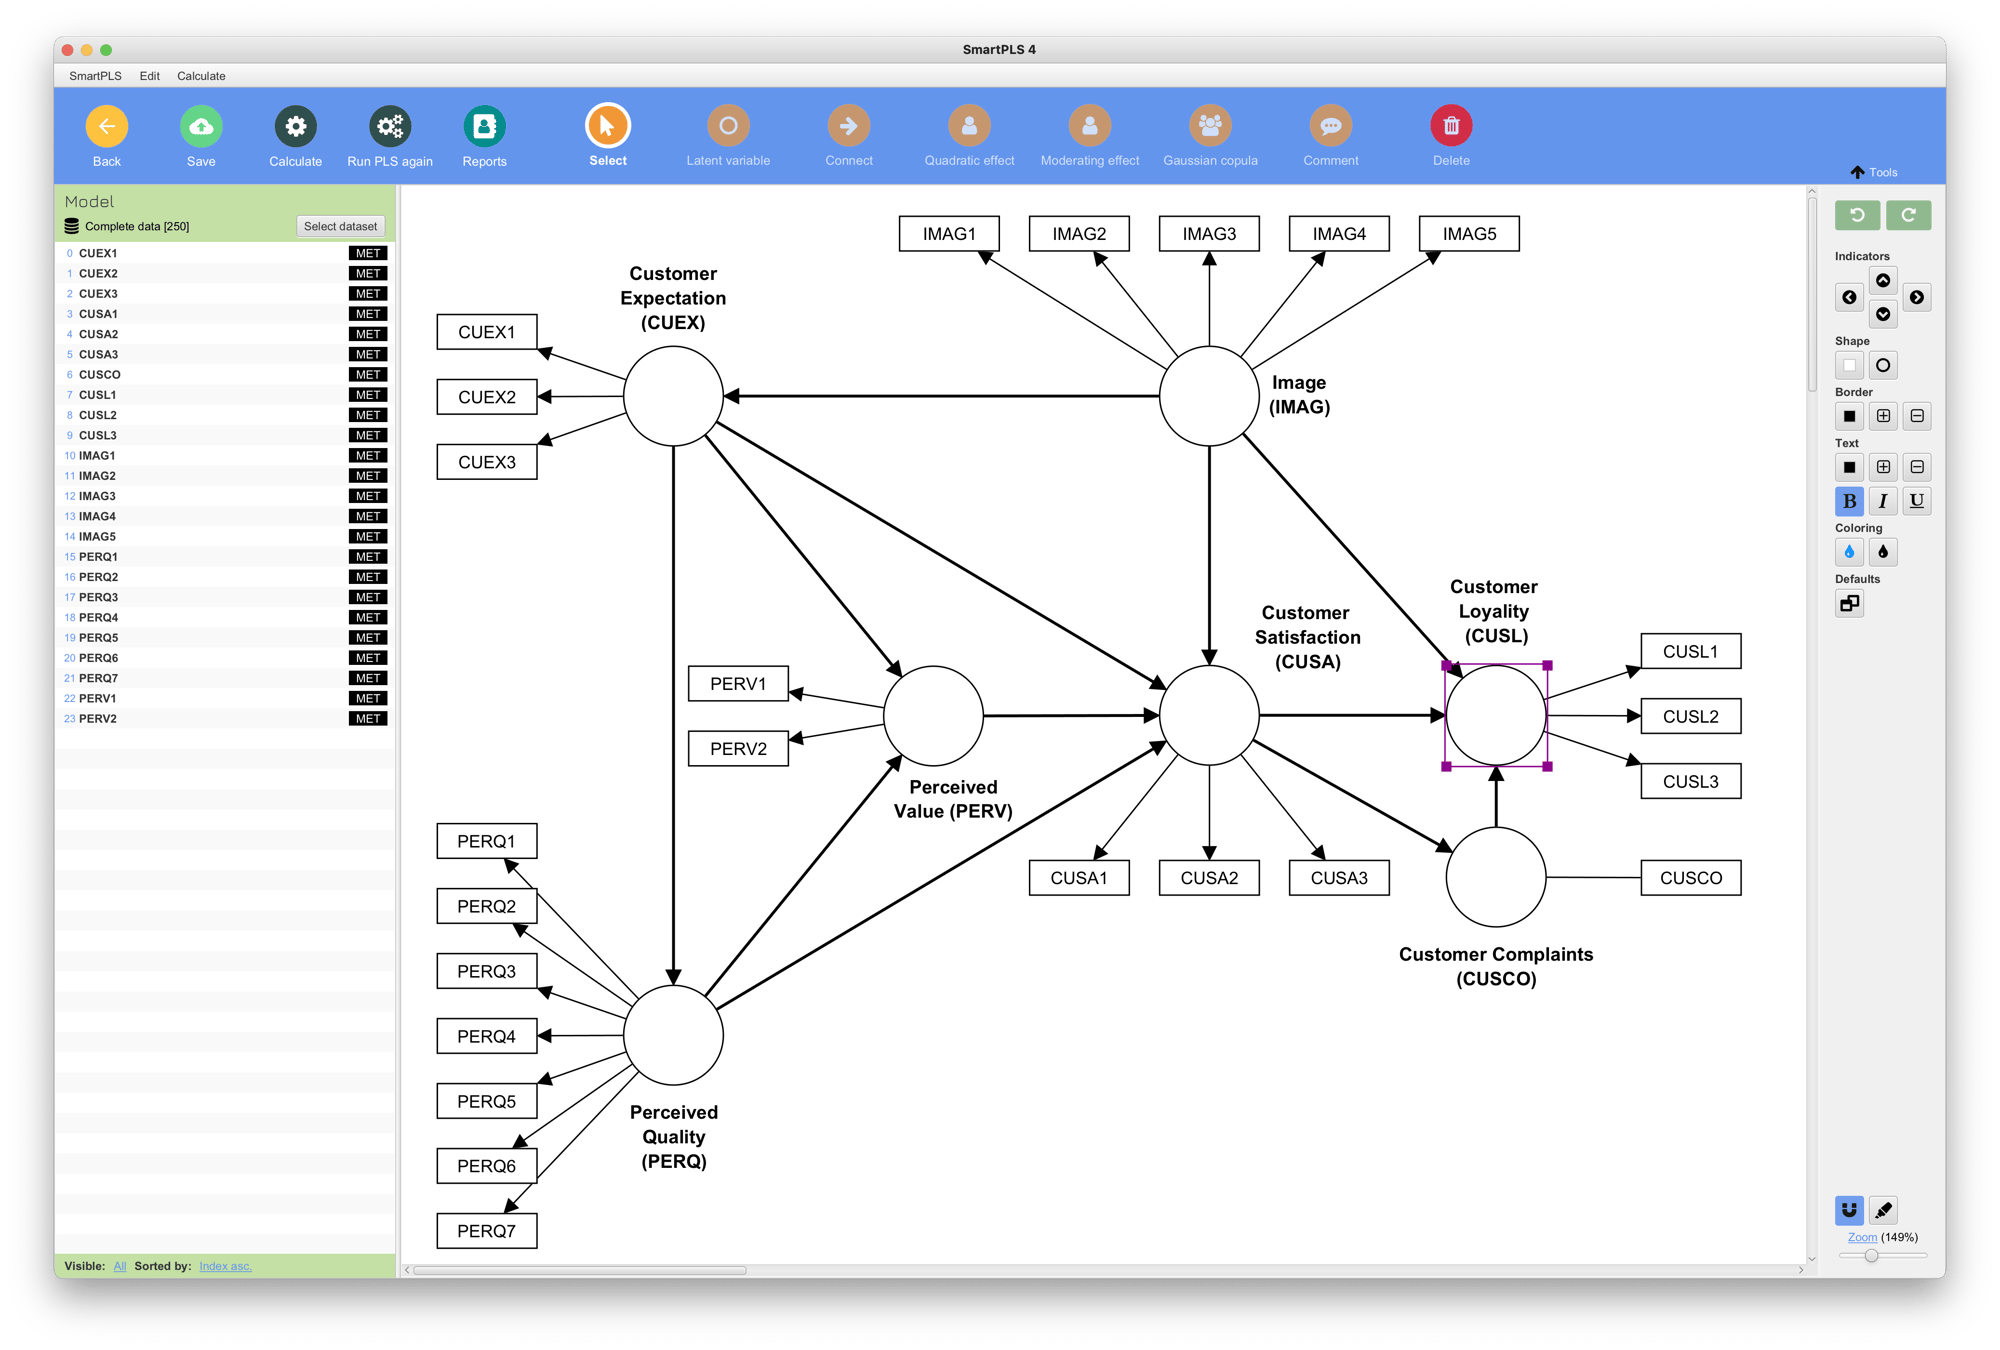
You can expect a fundamentally renewed and optimized GUI.
We have developed this over the last few years based on the latest technologies, so SmartPLS will have a long-term future.
Improved performance
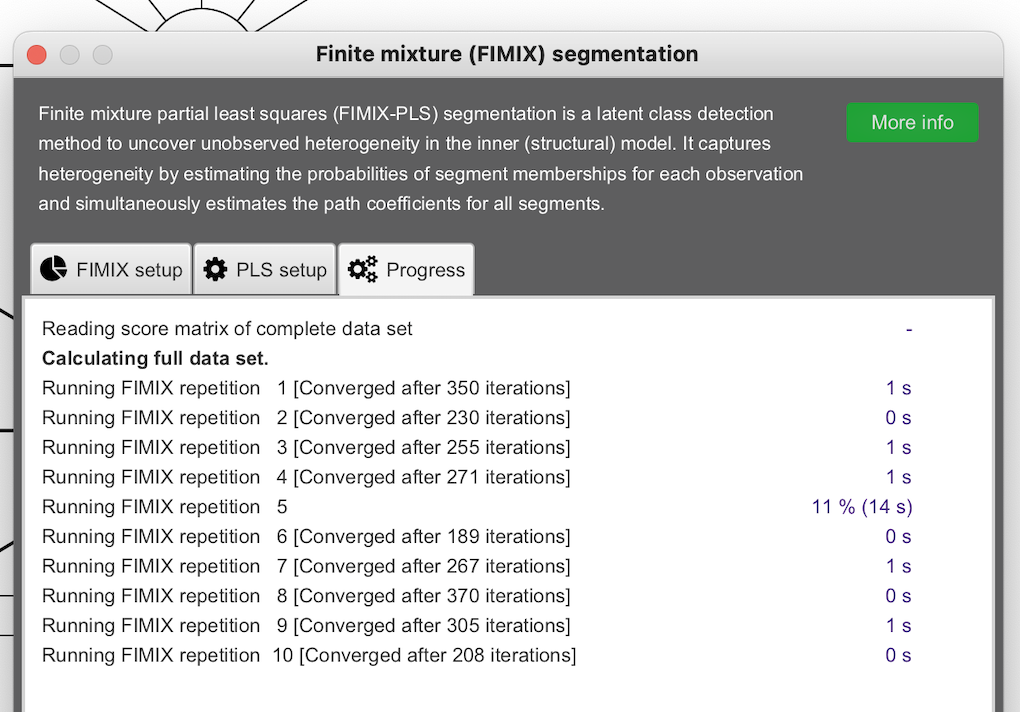
Performance has improved significantly in many areas. Algorithms like bootstrapping or FIMIX are now much faster.
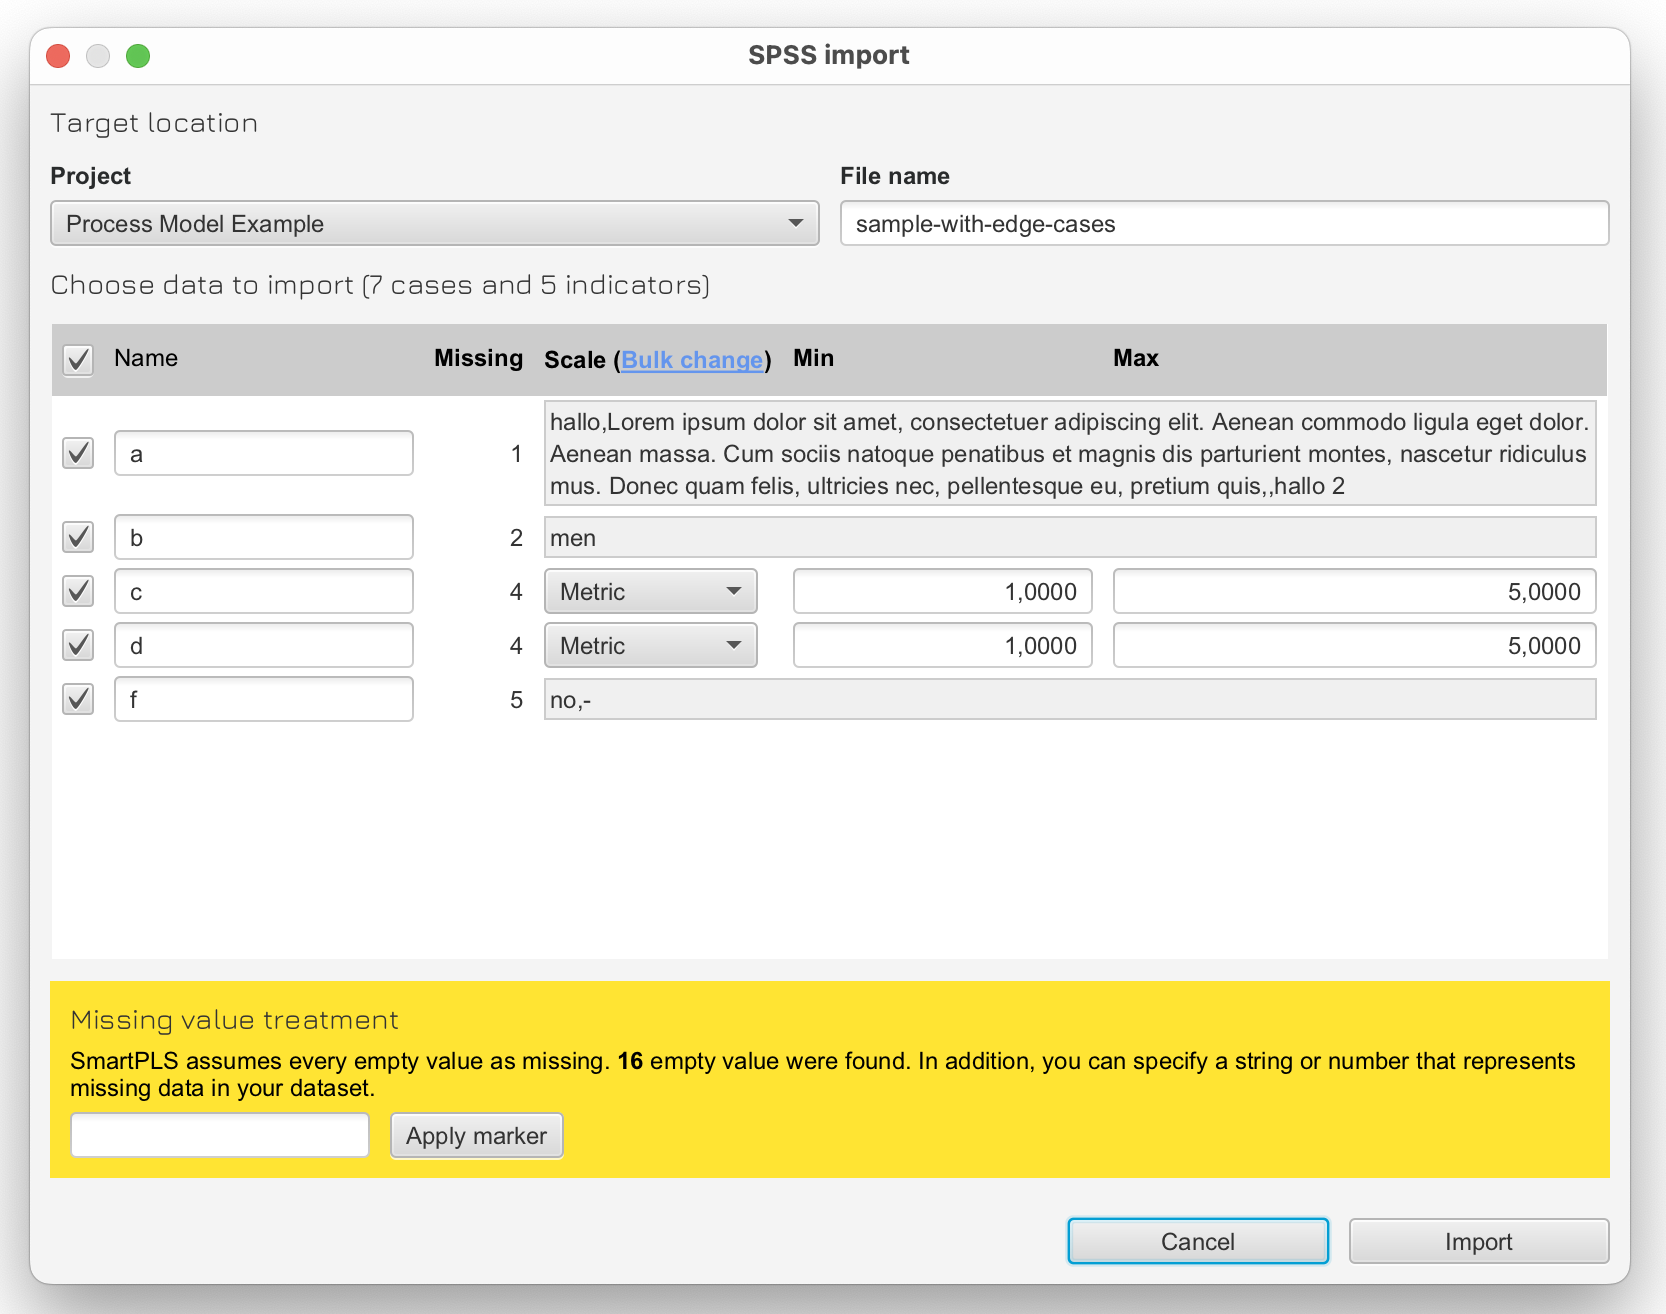
Improved data import
Data sets are often available in Excel or SPSS formats. SmartPLS can now read these directly, without prior conversion to a CSV file.
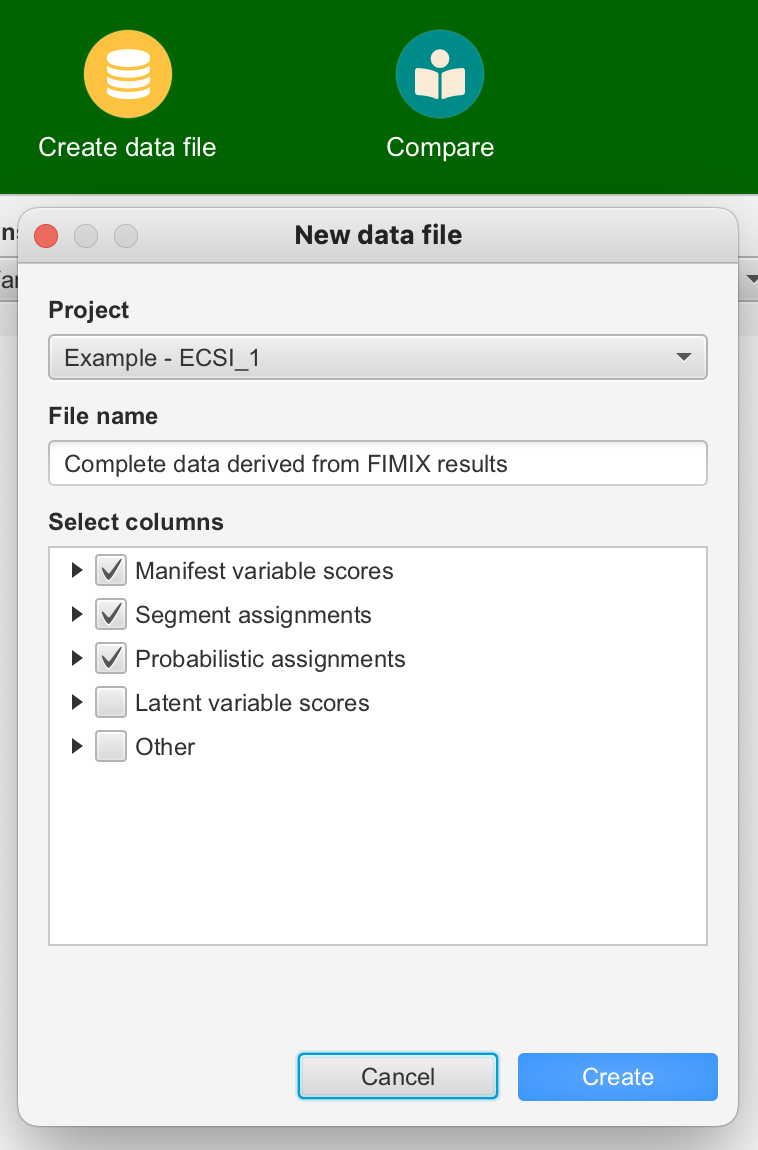
Generate new data files from your results
New datafiles can now be created from calculation results directly which is useful especiall for higher-order models.
You can select which data should be included in your new file - e.g. the scores from a PLS-SEM calculation. Immediately after that you can use the file for new calculations.
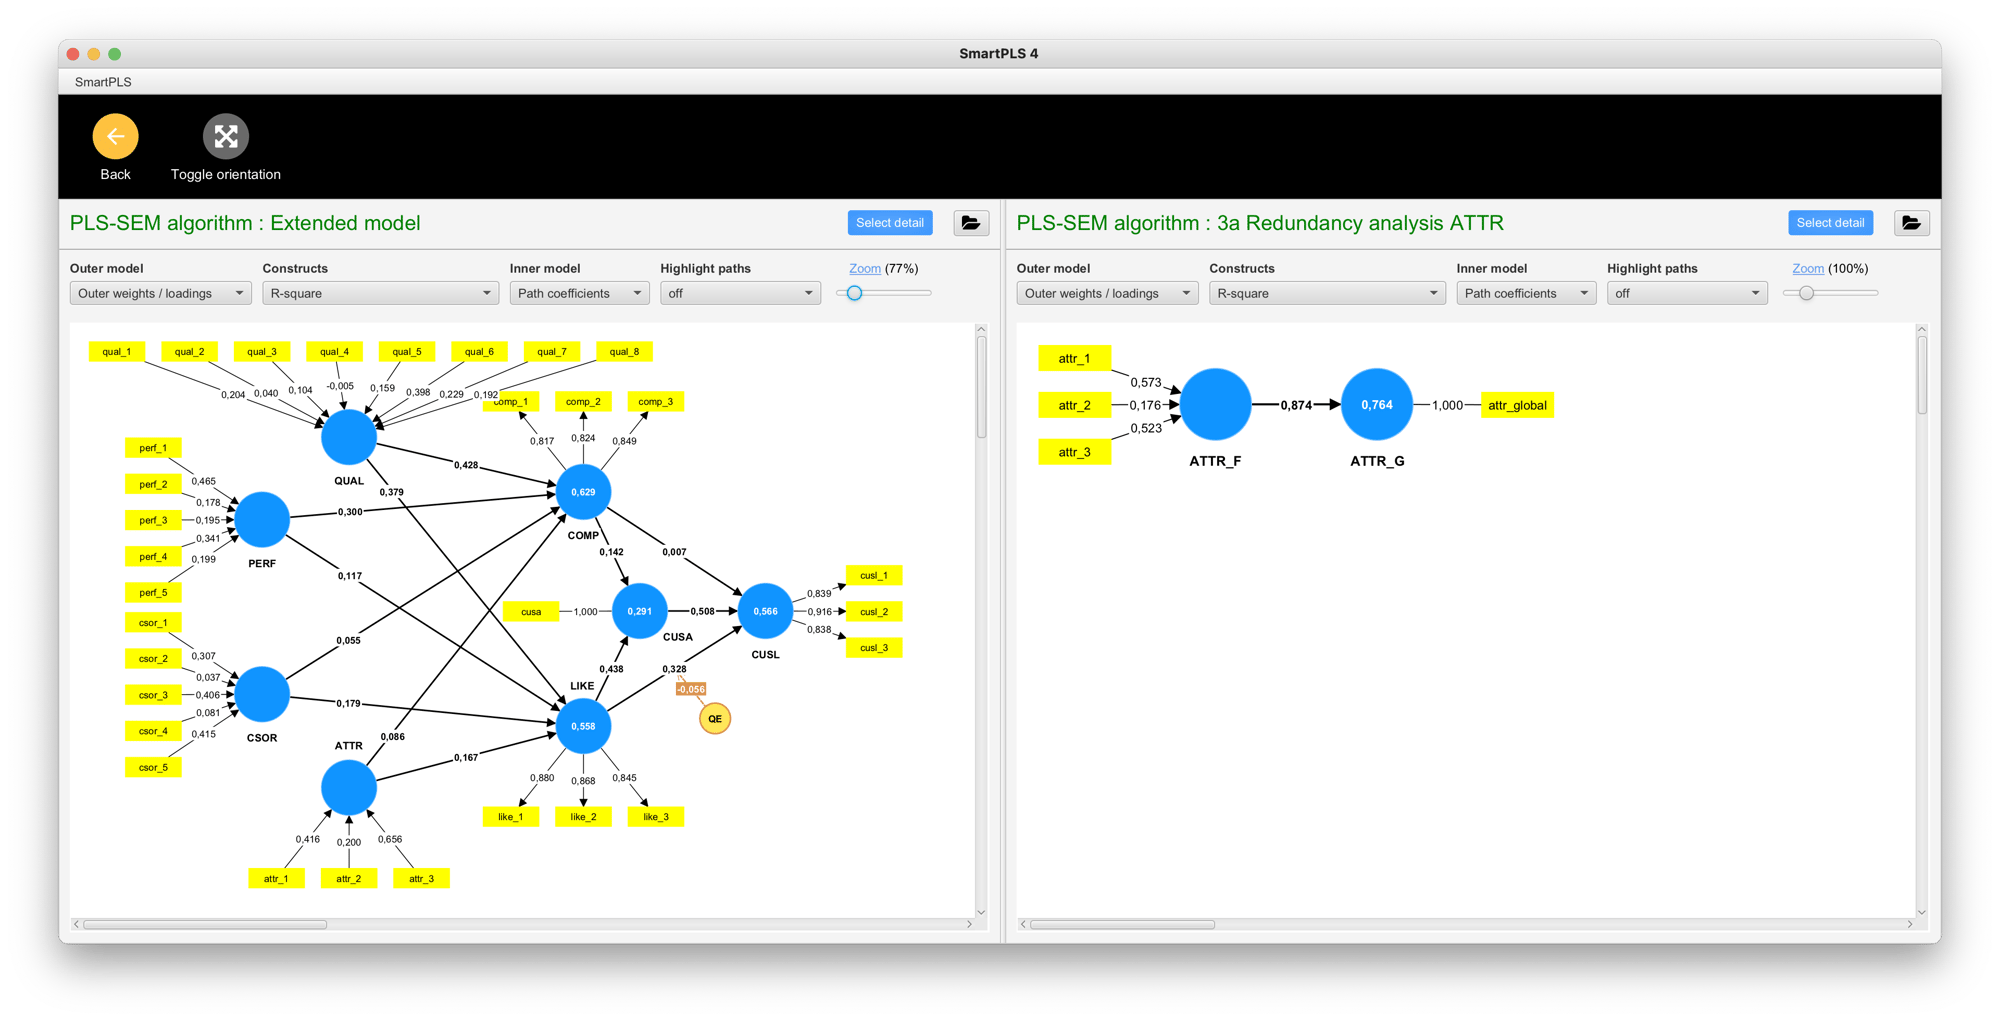
Side by side comparison
You can now compare reports more easily by simply opening them in our Compare View page.
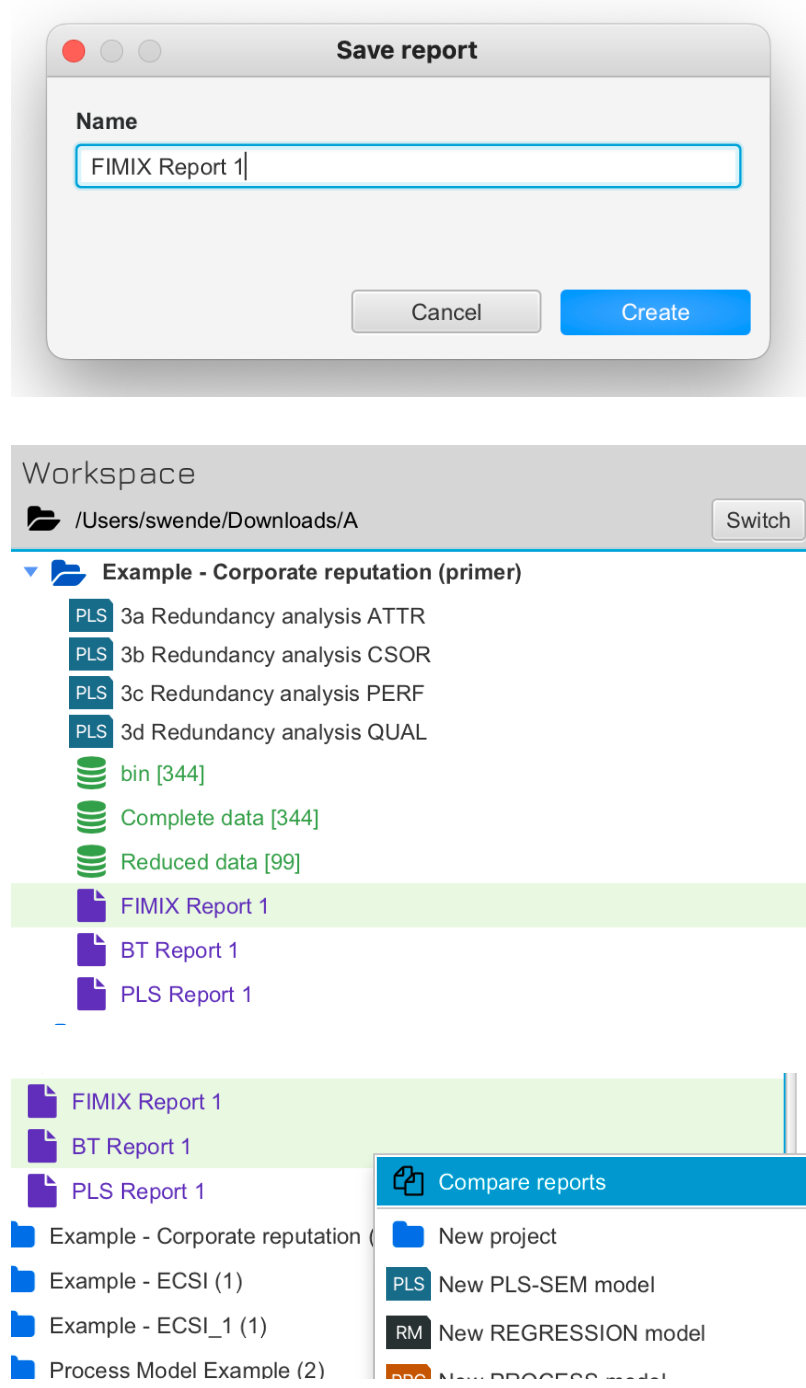
Save your reports
Finally, SmartPLS reports can now be saved and opened again later. Exporting to Excel or to a website is of course still possible as well.
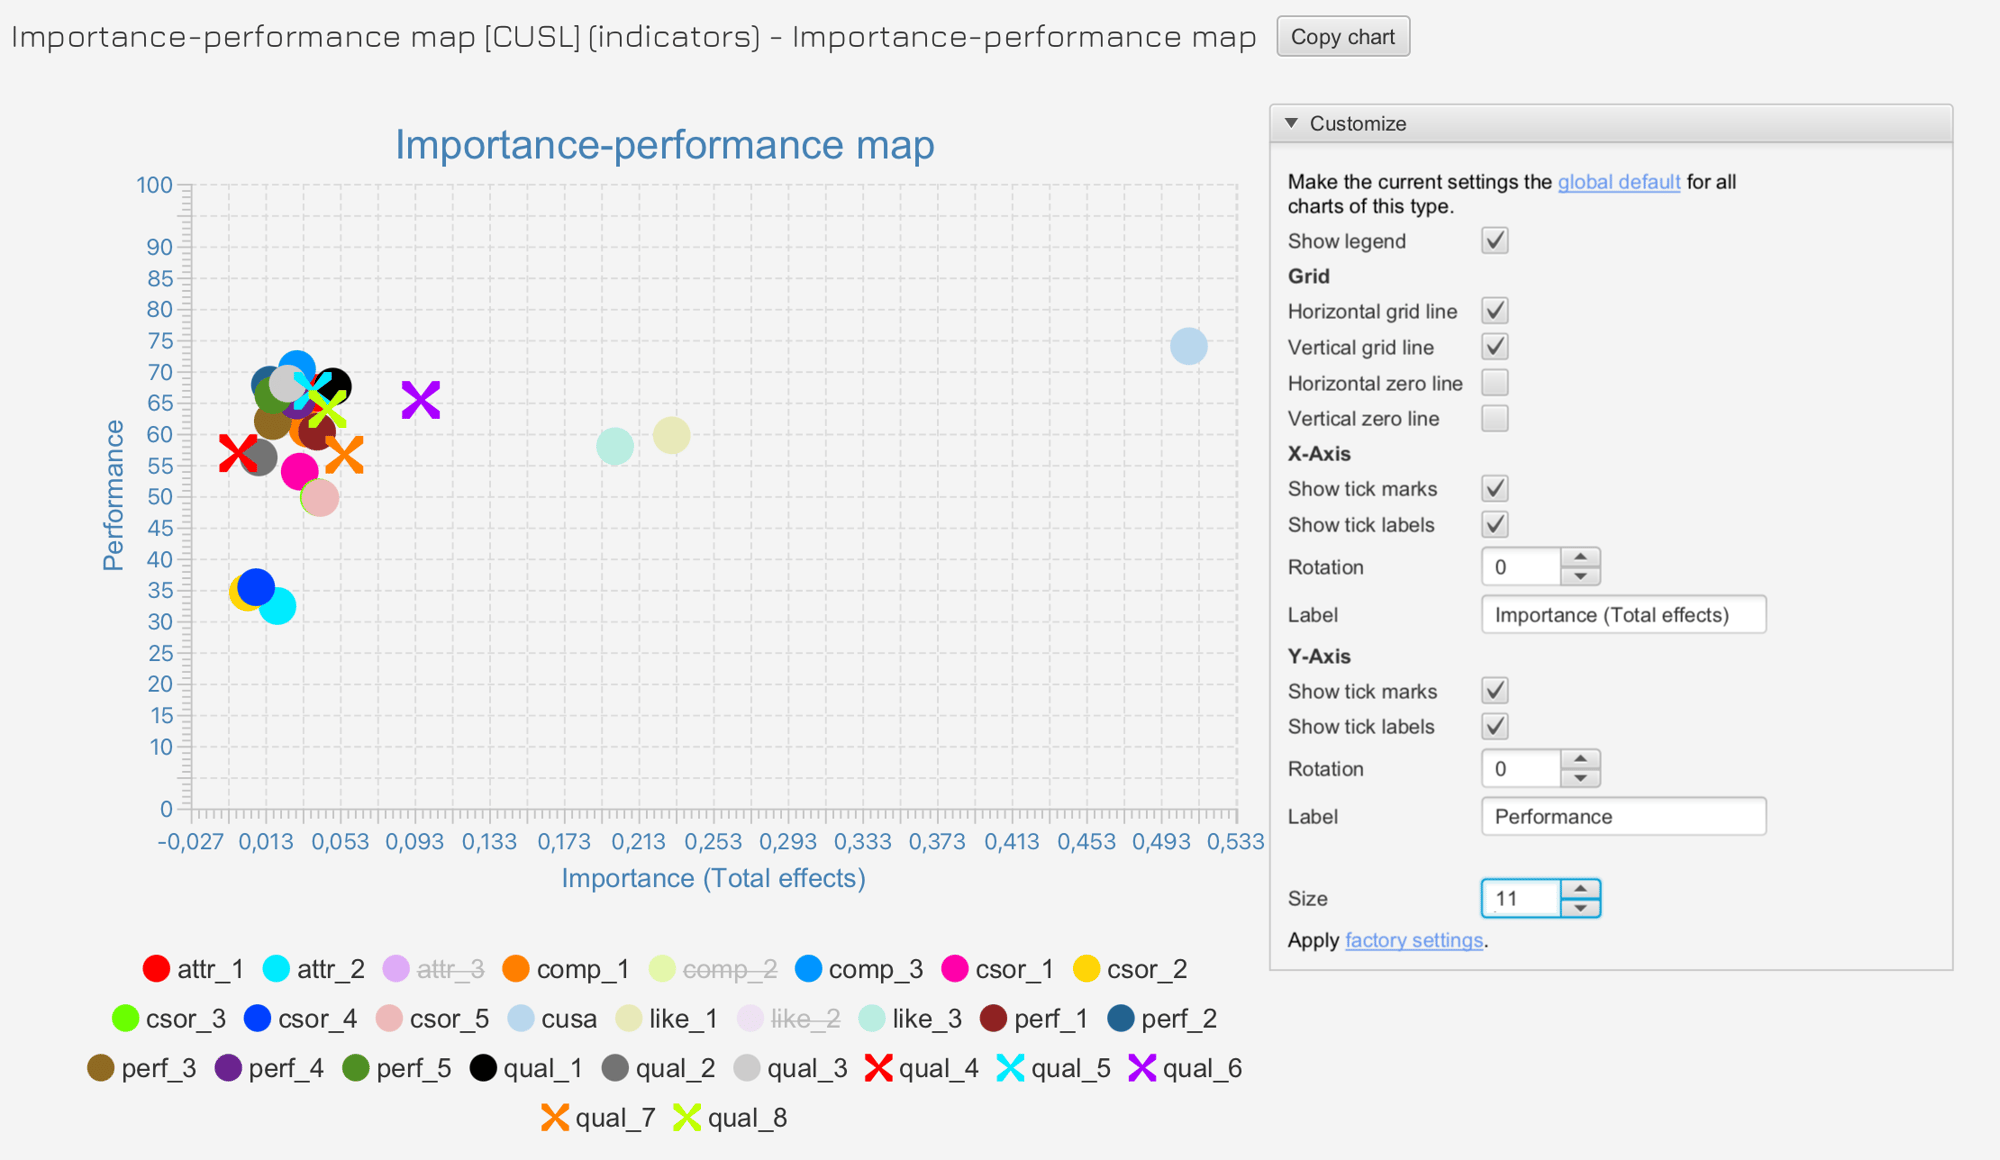
Customize charts
Diagrams can now be customized. For example, new colors or sizes for dots can be defined - but also many other properties can be changed and can also be saved as new defaults.
Many new methods
SmartPLS 4 now also supports new algorithms, model types and result representations. These include:
- Endogeneity assessment usign the Gaussian copula approach.
- Necessary condition analysis (NCA) including significance testing
- Regression models
- Path analysis and PROCESS, including bootstrapping of conditional direct and indirect effects
- Multiple moderation (e.g., three-way interactions)
- Accounting for scale type of variables in most algorithms
- Standardized, unstandardized and mean-centered PLS-SEM analysis
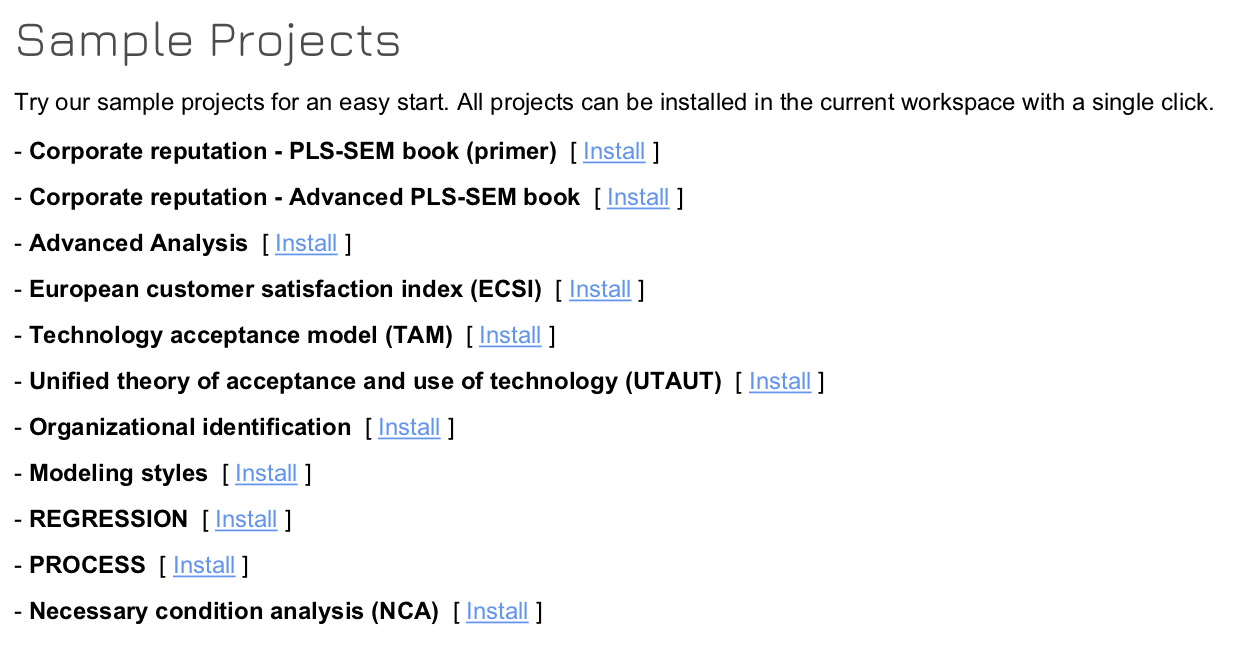
Many included example projects
There are now many different example model directly integrated in the software. So you can directly try out many of the functionalities, even without your own data.
SmartPLS in action – a quick video introduction series
The complete SmartPLS video tutorial playlist can be viewed here.
